In today’s data-driven environment, organizations rely heavily on statistical methods to make sense of vast and complex data sets. Two of the most essential tools in a statistician’s or data analyst’s toolkit are regression analysis and Analysis of Variance (ANOVA). These methods allow analysts to understand relationships among variables, test hypotheses, and generate predictions that guide decisions across industries.
This article serves as a detailed guide to practical regression and ANOVA using R, with a focus on real-world applications, conceptual clarity, and best practices. It avoids coding complexity and emphasizes understanding the methodology and applying insights using the capabilities of R software for data analysis.
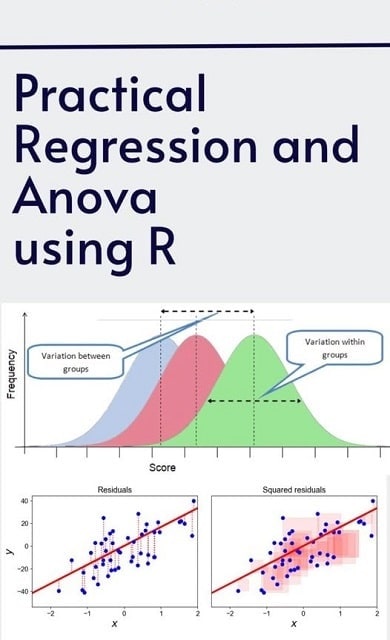
Understanding Regression and ANOVA in Statistical Analysis
Before diving into R, it’s important to understand the conceptual differences between regression and ANOVA:
- Regression analysis is used to predict the value of a dependent variable based on one or more independent variables.
- ANOVA tests the difference between means across multiple groups and helps determine whether those differences are statistically significant.
Both techniques stem from the general linear model and are fundamental for statistical modeling, predictive analytics, and experimental data analysis.
Linear Regression in R: A Practical Perspective
What is Linear Regression?
Linear regression models the relationship between a dependent variable (Y) and one or more independent variables (X). It is ideal for predictive modeling, trend forecasting, and quantitative analysis.
Types of Linear Regression
- Simple linear regression (one predictor)
- Multiple linear regression (two or more predictors)
Key Concepts in Linear Regression
- Coefficients: Show how much the dependent variable changes for each unit change in a predictor
- R-squared: Measures how well the independent variables explain the variability of the dependent variable
- P-values: Indicate whether predictors are statistically significant
- Residuals: Help assess model assumptions and detect anomalies or outliers
When using R, these metrics are automatically calculated and presented in a structured format, enabling quick and informed interpretations.
Applications of Regression in the Real World
Regression analysis is a cornerstone of predictive modeling. Here are a few real-world applications:
- Healthcare analytics: Predicting patient outcomes based on age, treatment type, and pre-existing conditions
- Retail forecasting: Estimating future sales from seasonality, promotions, and competitor pricing
- Financial risk modeling: Evaluating credit risk based on customer history, income, and spending patterns
- Public policy analysis: Assessing the effect of legislation on employment rates or crime statistics
R provides a platform to build these models and test their accuracy with data from real environments.
ANOVA in R: Step-by-Step Tutorial
What is ANOVA?
Analysis of Variance (ANOVA) is used to compare the means of three or more groups to determine if at least one group mean is significantly different. It is widely used in clinical trials, agricultural experiments, and industrial quality control.
For instance, imagine a pharmaceutical company comparing the effects of three different drugs. ANOVA helps determine if there’s a statistically significant difference in outcomes (like blood pressure reduction) between these treatment groups.
When to Use ANOVA
- One-Way ANOVA: To compare a single factor (e.g., different brands or treatments)
- Two-Way ANOVA: To analyze the interaction between two categorical factors (e.g., diet type and exercise frequency)
- Repeated Measures ANOVA: For analyzing data where the same subjects are measured multiple times
R handles all of these types effortlessly, offering clear outputs for F-values, p-values, and confidence intervals, along with support for visual summaries like boxplots and mean plots.
Download PDF: Practical Regression and ANOVA Using R
Post-Hoc Testing
If ANOVA finds a significant difference among groups, post-hoc tests (such as Tukey’s HSD) are used to determine which specific groups differ. R provides easy-to-implement tools to perform these tests, ensuring researchers avoid incorrect conclusions from multiple comparisons.
Best Practices When Using R for Regression and ANOVA
Whether you’re analyzing experimental or observational data, the following best practices ensure robust and reliable results:
- Check assumptions: Always assess normality, homoscedasticity, and linearity using diagnostic tools.
- Clean your data: Remove or impute missing values to avoid biased estimates.
- Interpret carefully: Statistical significance doesn’t always imply practical significance.
- Use visualizations: Leverage R’s plotting capabilities to support findings with clear visuals.
- Validate your model: Apply cross-validation or holdout samples to test the model’s performance.
Leveraging R for Advanced Statistical Modeling
Beyond basic regression and ANOVA, R supports more complex and customized modeling, including:
- Polynomial regression for nonlinear trends
- Logistic regression for binary outcomes like success/failure
- Mixed-effects models to handle hierarchical or grouped data
- ANCOVA (Analysis of Covariance) which blends ANOVA with regression
These tools are critical for advanced analytics in research, economics, machine learning, and business intelligence.
Conclusion
Regression and ANOVA are vital tools in modern data analysis. By understanding their applications, assumptions, and outputs, analysts can turn raw data into powerful, actionable insights. When powered by the R programming environment, these methods become even more accessible and impactful.