In the world of data science and analytics, identifying relationships between variables is a crucial step in understanding the underlying patterns within data. One of the most widely used statistical techniques to measure these relationships is correlation analysis.
Understanding the correlation coefficient and performing a correlation test in R allows analysts and researchers to quantify and validate the strength and direction of relationships between numerical variables.
What is a Correlation Coefficient?
Table of Contents
ToggleThe correlation coefficient is a statistical measure that expresses the degree to which two variables are linearly related. In simpler terms, it tells us how closely one variable moves in relation to another. The value of the correlation coefficient (commonly represented as r) ranges from -1 to +1.
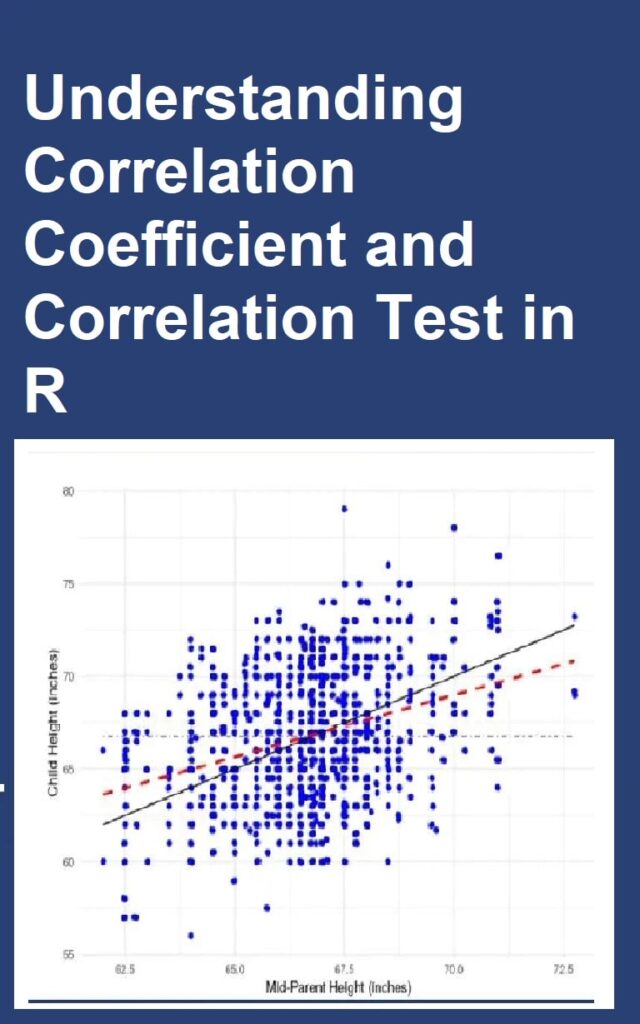
- +1 (Perfect Positive Correlation): As one variable increases, the other variable also increases proportionally.
- 0 (No Correlation): There is no predictable relationship between the two variables.
- -1 (Perfect Negative Correlation): As one variable increases, the other decreases proportionally.
For example, a strong positive correlation might be observed between advertising spending and sales revenue, while a negative correlation may be observed between interest rates and loan demand.
Types of Correlation Coefficients
In R, several types of correlation coefficients can be calculated depending on the nature of the data and its distribution. The three most common ones are:
1. Pearson Correlation Coefficient
The Pearson correlation is the most widely used measure of linear correlation between two continuous variables. It assumes that the data follows a normal distribution and that the relationship between variables is linear.
It is sensitive to outliers and works best when the relationship between variables is consistent across all data points.
2. Spearman’s Rank Correlation Coefficient
When the data does not follow a normal distribution or contains outliers, the Spearman correlation is preferred. It measures the monotonic relationship between two variables based on the rank order of data rather than the actual values.
3. Kendall’s Tau Correlation Coefficient
The Kendall’s Tau coefficient is another non-parametric test used to measure the strength and direction of association between two ranked variables. It is particularly robust when dealing with small sample sizes or ordinal data.
Importance of Correlation Analysis in Data Science
Understanding the correlation coefficient is essential for data scientists, business analysts, and researchers because it helps to:
- Identify key relationships between variables that can influence predictive modeling. By measuring how strongly two variables move together, analysts can determine which factors significantly impact outcomes, helping refine models and improve their interpretability.
- Detect multicollinearity in regression models, which can affect the accuracy of predictions. High correlations among independent variables may distort model coefficients, leading to unreliable or unstable results.
- Support decision-making by revealing associations in financial, marketing, or scientific data. Correlation insights help professionals recognize meaningful patterns that guide business or research strategies.
- Simplify feature selection by eliminating redundant or highly correlated variables in machine learning models, thereby improving model efficiency and reducing overfitting.
For instance, in a financial risk analysis, understanding how market indices move together helps portfolio managers manage diversification and investment risk.
Performing a Correlation Test in R
A correlation test statistically evaluates whether the observed correlation between two variables is significantly different from zero. In R, this is done using the cor.test() function.
The test provides:
- The correlation coefficient (r value), which quantifies the degree of linear association between the variables.
- The p-value which indicates statistical significance and helps determine whether the observed correlation is likely due to random chance.
- Confidence intervals for the correlation estimate, giving a range of plausible values for the true correlation.
The null hypothesis (H₀) assumes that there is no correlation between the two variables, whereas the alternative hypothesis (H₁) suggests that there is a significant correlation.
If the p-value is less than 0.05, it means there is strong evidence to reject the null hypothesis, indicating a statistically significant correlation.
Interpreting Correlation Test Results
When performing a correlation test in R, the results typically include several key statistics that should be interpreted carefully. Understanding these values is essential to accurately assessing the relationship between two variables and making meaningful inferences from the data.
- Correlation Coefficient (r): Indicates the strength and direction of the relationship between the variables. Values closer to 1 or -1 suggest a strong linear relationship, whereas values near 0 suggest little to no linear relationship. Specifically:
- 1 to 0.3 → Weak correlation
- 3 to 0.7 → Moderate correlation
- 7 to 1.0 → Strong correlation
- P-value: Helps determine whether the correlation is statistically significant. A p-value less than 0.05 implies that the observed correlation is unlikely due to random chance, providing evidence that the relationship observed in the sample reflects a real association in the population.
- Confidence Interval: Provides a range within which the true correlation is likely to fall. A narrow confidence interval indicates higher reliability and precision of the correlation estimate, whereas a wide interval suggests more uncertainty about the true strength of the relationship.
Applications of Correlation Analysis in Real-World Data
Correlation analysis has vast applications across industries. Some of the most common areas include:
- Finance and Investment Analysis: Identifying how stock prices move in relation to market indices helps investors understand market trends, diversify portfolios, and make informed decisions about buying or selling assets. It also aids in risk assessment and predicting potential market fluctuations.
- Marketing Analytics: Understanding how advertisement spend correlates with sales volume or brand awareness enables marketers to optimize campaigns, allocate budgets more efficiently, and measure the return on investment for various marketing channels.
- Healthcare Data Analysis: Measuring the association between patient age and recovery time allows healthcare professionals to predict treatment outcomes, customize care plans, and improve patient management strategies.
- Social Science Research: Exploring the relationship between education level and income helps researchers identify social patterns, study economic mobility, and inform policy decisions.
- Machine Learning and Predictive Modeling: Selecting features that have meaningful relationships with the target variable improves model accuracy, reduces overfitting, and enhances predictive performance.
By leveraging correlation analysis in R, businesses and researchers can make data-driven decisions backed by statistical evidence.
Learn For Free: Understanding Correlation Coefficient and Correlation Test in R
Limitations of Correlation Analysis
While correlation provides valuable insights into the relationship between two variables, it is essential to remember that correlation does not imply causation. A high correlation between two variables does not necessarily mean that one variable directly causes changes in the other. Other underlying factors, often referred to as confounding variables, may influence the observed relationship and create misleading interpretations if not properly accounted for.
Additionally:
- Correlation only captures linear relationships, meaning it may fail to detect meaningful associations that follow non-linear patterns.
- Outliers can significantly distort the correlation coefficient, exaggerating or diminishing the apparent strength of the relationship.
- It does not account for complex interactions between variables or the influence of multiple factors simultaneously.
Therefore, correlation should be considered primarily as an initial analytical step, often followed by regression analysis, causal inference models, or other advanced statistical techniques for a more thorough and reliable investigation of variable relationships.
Conclusion
Understanding the correlation coefficient and correlation test in R is fundamental for any data-driven professional. It forms the foundation for many advanced statistical and predictive modeling techniques. By mastering how to interpret correlation results and apply them correctly, analysts can uncover valuable insights, enhance the reliability of their models, and make more informed business decisions.